Page 315 - Annuaire Statistique Québec - 1918
P. 315
AGRICULTURE                               271

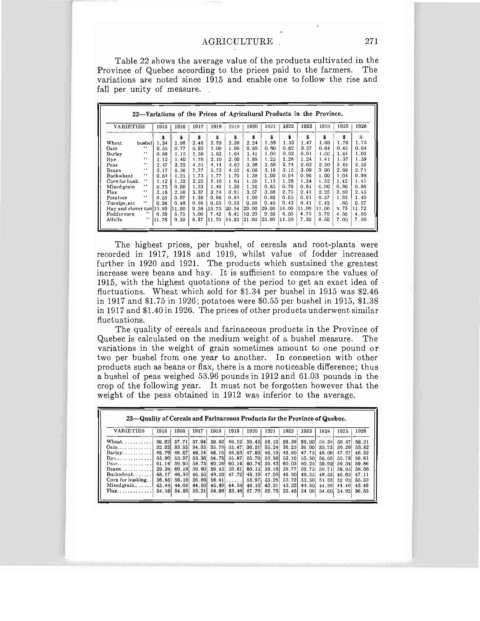
                              Table 22 shows the average value oi the products cultivated in the
                          Province of Quebec aecording to the priees paid to the farmers.    The
                          variations are noted since 1915 and enable one to follow the rise and
                          fall pel' unity of measure.


                                   22-Varlations or the Priees or AgriculLural Products in the Province.
                              VARlETŒS   1915  1916  1917  1918  Il:1Hl  IQ20  1021  1922  1923  1924 ' 1925  l{IZB
                                                        $ 1-$-               1-----
                                          S    J   li            li   ~    S   $   li   li
                                      ..
                            Whea~   busbe)  1.34  1. 86  2.46  2.28  2.38  2.24  1.59  1.53  1.47  1.66  1. 76  1. 7.';
                            On~.      ..  0.55  0.77  0.92  1. 00  1.06  0.88  0.00  0.62  a.57  0.64  0.61  0.64
                            Bnrley       0.86  1. 15  1.58  1. 62  J.04  1.4L  1.00  0.92  0.91  Lee  1. 01  1. 02
                            Hy~       .. l'  1. 12  1.40  1. 78  2.10  2.00  1. 88  1.2  1.26  1.24  1.41  J. 37  1. 59
                            Pe"s      ..  2.47  3.22  4.51  4.14  3.62  3.36  2.50  2.74  2.63  2.50  2.64  2.52
                            Ben..D!:!  ..  3.17  5.56  7.77  5.72  4.1j'2  4.08  3.18  3.15  3.09  3 00  2.99  2.71
                            Buckwheal    0.84  1.21  1.73  1.77  1.70  l. 38  1.00  0.94  0.96  1. 00  l.Oi  0.98
                            Corn Ior husk. " ..  1. 12  1. ;;2  2.25  2.10  1 IH  1. 59  1.15  1. 28 i 1.54  1. 52  1. 42  1. 41
                            Mixectgrnin  ü.73  0.90  1.33  1.46  1.50  1.20  0.85  0.79  0.81  G.no  0.86  0.86
                            Flux      "  2.18  2.50  3.37  3.74  3.01  3.57  3.56  2.7r. , 2.41  2.25  2.S0  2.45
                            Potatoes  .. "  0.55  0.97  1. 38  0.Q8  0.85  1. 00  0.80  0.65  0.01  0.57  1.05  1. 40
                            Ttlruip!. etc  0.36  0.48  0.59  0.63  0.53  0.50  0.40  0.43  0.41  0.42  .60  0.57
                            Hay •.od clover ton 1.;.89 11.00  9.58 15.75 20.54  20.00 29.00 14.00 11.00 11. 00  ~. 73  11.72
                            Foddorcorn   6.39  6.75  5.00  7.42  8.41  10.20  0.50  6.50  4.7.;  5.70  4.50  4.60
                            Alfalf•.  "  lI. 78  9.50  8.37 11.70  14.22 21.00 25.00 11.50  7.50  8.50  7.00  7.50
                              The highest pnces, pel' bushel, oi eereals and root-plants were
                          recorded in 1917, 1918 and 1919, whilst value of iodder inereased
                          further in 1920 and 1921. The products which sustained the greatest
                          inerease were beans and hay. It is sufficient to compare the values of
                          1915, with the highest quotations of the period to get an exact idea of
                          fluctuations. Wheat which sold for $1.34 pel' bushel in 1915 was $2.46
                          in 1917 and $1.75 in 1926; potatoes were $0.55 pel' bushel in 1915, $1.38
                          in 1917 and $1.40 in 1926. The priees of other products underwent similar
                          fluctuations.
                              The quality of cereals and farinaceous products in the Province of
                          Quebee is calculated on the med'ium weight of a bushe! measure.     The
                          variations in the weight of grain sometimes amount to one pound or
                          two pel' bushel from one year ta another.    In connection with other
                          produets sueh as beans or Bax, there is a more noticeable difference; thus
                          a bushel of peas weighed 53.96 pounds in 1912 and 61.03 paunds in the
                          erop oi the following year.  It must not be forgotten however that the
                          weight of the peas obtained in 1912 was inferior to the averag6.


                                 23-Qnnlily ofCereals IUld Farlnaeeous Prodncts for the Province or Quebec.
                              VARŒTlES   1916  HHI)  1917  1918  1019  1920  Jfl21  1022  1923  1924  1925  1926
                                             -- ------1----- --                   -_.  -- --
                            Wheat...........  W.02 57.71  57.94  58.82  ~9. 12 59.45 58.10 59.39 69.00 59.as 69.87 58.21
                            Oal. ............  32.!J2 33.55 34.35 35.78 35.47 36.51  35.24 36.25 36.00 35.75  3~.29 33.82
                            Bacley...........  48.70 46.67 48.14  48.16 48.G3 47.83 40.19 46.80 47.75 48.0\1 47.97 46.52
                            Rye... ...........  5.';.90 53.07 53.36. 54.78 55.87  65.70 53.S8 53.10 55 ..10 51l.05 55.73 56.81
                            !Je:.l:"! .....•.....••  61. J4  !iH. 9.~) .'l8.75 60.26 00.14  60.74  59.43 00.03 60.25 ,';9.92 59.34 69.86
                            BeanA............  59.3S; 60.18 !,0.90 59.45 50.81  00.15 39.16 58.77 60.75  ~jU. 71 58.95 ,.'l.06
                            Buckwhe,nL ......  48.17  46.:l~ 46.55 48.20 47.72  48. Hl 47.0g 4G.20 48.25 4R.53 46.03 -17.11
                            Corn rùr hUl'king..  85 50.18 56.89 56.41 ......  55.97 65. 28 53.72 55.50 5l 33 52 03 55.32
                                                                   1
                                         56.
                            lVHxedgraiJl.......  45.44  1 44.04  44.50 45.4P 44.54  4B.I0.43.31  43.32 44.60 14.89 44 .46 '13.49
                            F1llX....•....•...  54 .16 64.50 53.21  64.G6  53.46  67. 79 1 liZ.78 52.46 54 00 54.60 '54.92 56.55

